Static Analysis
Static analysis refers to programs analyzing source code to find potential issues such as bugs, antipatterns, and other issues that can be diagnosed without executing the program. The “static” part specifically refers to analyzing the source code instead of a running program (referred to as “dynamic” analysis). Static analysis can find bugs in programs early, before they are checked in as production code. For example, static analysis can identify constant expressions that overflow, tests that are never run, or invalid format strings in logging statements that would crash when executed.1 However, static analysis is useful for more than just finding bugs. Through static analysis at Google, we codify best practices, help keep code current to modern API versions, and prevent or reduce technical debt. Examples of these analyses include verifying that naming conventions are upheld, flagging the use of deprecated APIs, or pointing out simpler but equivalent expressions that make code easier to read. Static analysis is also an integral tool in the API deprecation process, where it can prevent backsliding during migration of the codebase to a new API (see Large-Scale Changes). We have also found evidence that static analysis checks can educate developers and actually prevent antipatterns from entering the codebase.2
In this chapter, we’ll look at what makes effective static analysis, some of the lessons we at Google have learned about making static analysis work, and how we implemented these best practices in our static analysis tooling and processes.3
Characteristics of Effective Static Analysis
Although there have been decades of static analysis research focused on developing new analysis techniques and specific analyses, a focus on approaches for improving scalability and usability of static analysis tools has been a relatively recent development.
Scalability
Because modern software has become larger, analysis tools must explicitly address scaling in order to produce results in a timely manner, without slowing down the software development process. Static analysis tools at Google must scale to the size of Google’s multibillion-line codebase. To do this, analysis tools are shardable and incremental. Instead of analyzing entire large projects, we focus analyses on files affected by a pending code change, and typically show analysis results only for edited files or lines. Scaling also has benefits: because our codebase is so large, there is a lot of low-hanging fruit in terms of bugs to find. In addition to making sure analysis tools can run on a large codebase, we also must scale up the number and variety of analyses available. Analysis contributions are solicited from throughout the company. Another component to static analysis scalability is ensuring the process is scalable. To do this, Google static analysis infrastructure avoids bottlenecking analysis results by showing them directly to relevant engineers.
Usability
When thinking about analysis usability, it is important to consider the cost-benefit trade-off for static analysis tool users. This “cost” could either be in terms of developer time or code quality. Fixing a static analysis warning could introduce a bug. For code that is not being frequently modified, why “fix” code that is running fine in production? For example, fixing a dead code warning by adding a call to the previously dead code could result in untested (possibly buggy) code suddenly running. There is unclear benefit and potentially high cost. For this reason, we generally focus on newly introduced warnings; existing issues in otherwise working code are typically only worth highlighting (and fixing) if they are particularly important (security issues, significant bug fixes, etc.). Focusing on newly introduced warnings (or warnings on modified lines) also means that the developers viewing the warnings have the most relevant context on them.
Also, developer time is valuable! Time spent triaging analysis reports or fixing highlighted issues is weighed against the benefit provided by a particular analysis. If the analysis author can save time (e.g., by providing a fix that can be automatically applied to the code in question), the cost in the trade-off goes down. Anything that can be fixed automatically should be fixed automatically. We also try to show developers reports about issues that actually have a negative impact on code quality so that they do not waste time slogging through irrelevant results.
To further reduce the cost of reviewing static analysis results, we focus on smooth developer workflow integration. A further strength of homogenizing everything in one workflow is that a dedicated tools team can update tools along with workflow and code, allowing analysis tools to evolve with the source code in tandem.
We believe these choices and trade-offs that we have made in making static analyses scalable and usable arise organically from our focus on three core principles, which we formulate as lessons in the next section.
Key Lessons in Making Static Analysis Work
There are three key lessons that we have learned at Google about what makes static analysis tools work well. Let’s take a look at them in the following subsections.
Focus on Developer Happiness
We mentioned some of the ways in which we try to save developer time and reduce the cost of interacting with the aforementioned static analysis tools; we also keep track of how well analysis tools are performing. If you don’t measure this, you can’t fix problems. We only deploy analysis tools with low false-positive rates (more on that in a minute). We also actively solicit and act on feedback from developers consuming static analysis results, in real time. Nurturing this feedback loop between static analysis tool users and tool developers creates a virtuous cycle that has built up user trust and improved our tools. User trust is extremely important for the success of static analysis tools.
For static analysis, a “false negative” is when a piece of code contains an issue that the analysis tool was designed to find, but the tool misses it. A “false positive” occurs when a tool incorrectly flags code as having the issue. Research about static analysis tools traditionally focused on reducing false negatives; in practice, low false-positive rates are often critical for developers to actually want to use a tool—who wants to wade through hundreds of false reports in search of a few true ones?4
Furthermore, perception is a key aspect of the false-positive rate. If a static analysis tool is producing warnings that are technically correct but misinterpreted by users as false positives (e.g., due to confusing messages), users will react the same as if those warnings were in fact false positives. Similarly, warnings that are technically correct but unimportant in the grand scheme of things provoke the same reaction. We call the user-perceived false-positive rate the “effective false positive” rate. An issue is an “effective false positive” if developers did not take some positive action after seeing the issue. This means that if an analysis incorrectly reports an issue, yet the developer happily makes the fix anyway to improve code readability or maintainability, that is not an effective false positive. For example, we have a Java analysis that flags cases in which a developer calls the contains method on a hash table (which is equivalent to containsValue) when they actually meant to call containsKey—even if the developer correctly meant to check for the value, calling containsValue instead is clearer. Similarly, if an analysis reports an actual fault, yet the developer did not understand the fault and therefore took no action, that is an effective false positive.
Make Static Analysis a Part of the Core Developer Workflow
At Google, we integrate static analysis into the core workflow via integration with code review tooling. Essentially all code committed at Google is reviewed before being committed; because developers are already in a change mindset when they send code for review, improvements suggested by static analysis tools can be made without too much disruption. There are other benefits to code review integration. Developers typically context switch after sending code for review, and are blocked on reviewers—there is time for analyses to run, even if they take several minutes to do so. There is also peer pressure from reviewers to address static analysis warnings. Furthermore, static analysis can save reviewer time by highlighting common issues automatically; static analysis tools help the code review process (and the reviewers) scale. Code review is a sweet spot for analysis results.5
Empower Users to Contribute
There are many domain experts at Google whose knowledge could improve code produced. Static analysis is an opportunity to leverage expertise and apply it at scale by having domain experts write new analysis tools or individual checks within a tool. For example, experts who know the context for a particular kind of configuration file can write an analyzer that checks properties of those files. In addition to domain experts, analyses are contributed by developers who discover a bug and would like to prevent the same kind of bug from reappearing anywhere else in the codebase. We focus on building a static analysis ecosystem that is easy to plug into instead of integrating a small set of existing tools. We have focused on developing simple APIs that can be used by engineers throughout Google—not just analysis or language experts—to create analyses; for example, Refaster6 enables writing an analyzer by specifying pre- and post-code snippets demonstrating what transformations are expected by that analyzer.
Tricorder: Google’s Static Analysis Platform
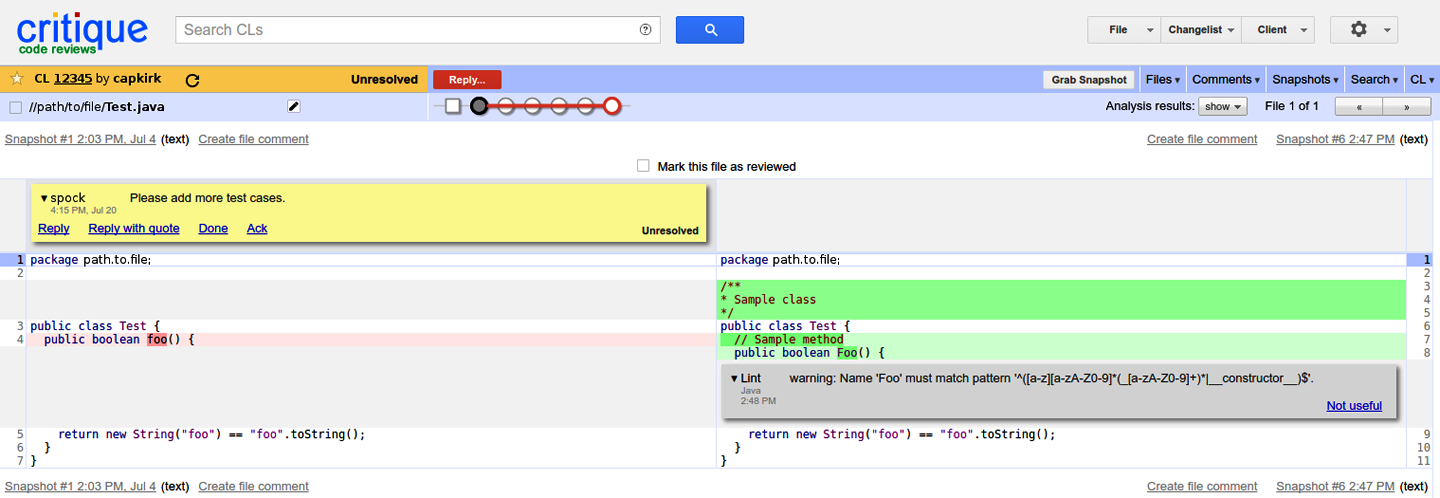
Tricorder, our static analysis platform, is a core part of static analysis at Google.7 Tricorder came out of several failed attempts to integrate static analysis with the developer workflow at Google;8 the key difference between Tricorder and previous attempts was our relentless focus on having Tricorder deliver only valuable results to its users. Tricorder is integrated with the main code review tool at Google, Critique. Tricorder warnings show up on Critique’s diff viewer as gray comment boxes, as demonstrated in Figure 20-1.
To scale, Tricorder uses a microservices architecture. The Tricorder system sends analyze requests to analysis servers along with metadata about a code change. These servers can use that metadata to read the versions of the source code files in the change via a FUSE-based filesystem and can access cached build inputs and outputs. The analysis server then starts running each individual analyzer and writes the output to a storage layer; the most recent results for each category are then displayed in Critique. Because analyses sometimes take a few minutes to run, analysis servers also post status updates to let change authors and reviewers know that analyzers are running and post a completed status when they have finished. Tricorder analyzes more than 50,000 code review changes per day and is often running several analyses per second.
Developers throughout Google write Tricorder analyses (called “analyzers”) or contribute individual “checks” to existing analyses. There are four criteria for new Tricorder checks:
- Be understandable
- Be easy for any engineer to understand the output.
- Be actionable and easy to fix
- The fix might require more time, thought, or effort than a compiler check, and the result should include guidance as to how the issue might indeed be fixed.
- Produce less than 10% effective false positives
- Developers should feel the check is pointing out an actual issue at least 90% of the time.
- Have the potential for significant impact on code quality
- The issues might not affect correctness, but developers should take them seriously and deliberately choose to fix them.
Tricorder analyzers report results for more than 30 languages and support a variety of analysis types. Tricorder includes more than 100 analyzers, with most being contributed from outside the Tricorder team. Seven of these analyzers are themselves plug-in systems that have hundreds of additional checks, again contributed from developers across Google. The overall effective false-positive rate is just below 5%.
Integrated Tools
There are many different types of static analysis tools integrated with Tricorder.
Error Prone and clang-tidy extend the compiler to identify AST antipatterns for Java and C++, respectively. These antipatterns could represent real bugs. For example, consider the following code snippet hashing a field f of type long:
result = 31 * result + (int) (f ^ (f >>> 32));
Now consider the case in which the type of f is int. The code will still compile, but the right shift by 32 is a no-op so that f is XORed with itself and no longer affects the value produced. We fixed 31 occurrences of this bug in Google’s codebase while enabling the check as a compiler error in Error Prone. There are many more such examples. AST antipatterns can also result in code readability improvements, such as removing a redundant call to .get() on a smart pointer.
Other analyzers showcase relationships between disparate files in a corpus. The Deleted Artifact Analyzer warns if a source file is deleted that is referenced by other non-code places in the codebase (such as inside checked-in documentation). IfThisThenThat allows developers to specify that portions of two different files must be changed in tandem (and warns if they are not). Chrome’s Finch analyzer runs on configuration files for A/B experiments in Chrome, highlighting common problems including not having the right approvals to launch an experiment or crosstalk with other currently running experiments that affect the same population. The Finch analyzer makes Remote Procedure Calls (RPCs) to other services in order to provide this information.
In addition to the source code itself, some analyzers run on other artifacts produced by that source code; many projects have enabled a binary size checker that warns when changes significantly affect a binary size.
Almost all analyzers are intraprocedural, meaning that the analysis results are based on code within a procedure (function). Compositional or incremental interprocedural analysis techniques are technically feasible but would require additional infrastructure investment (e.g., analyzing and storing method summaries as analyzers run).
Integrated Feedback Channels
As mentioned earlier, establishing a feedback loop between analysis consumers and analysis writers is critical to track and maintain developer happiness. With Tricorder, we display the option to click a “Not useful” button on an analysis result; this click provides the option to file a bug directly against the analyzer writer about why the result is not useful with information about analysis result prepopulated. Code reviewers can also ask change authors to address analysis results by clicking a “Please fix” button. The Tricorder team tracks analyzers with high “Not useful” click rates, particularly relative to how often reviewers ask to fix analysis results, and will disable analyzers if they don’t work to address problems and improve the “not useful” rate. Establishing and tuning this feedback loop took a lot of work, but has paid dividends many times over in improved analysis results and a better user experience (UX)—before we established clear feedback channels, many developers would just ignore analysis results they did not understand.
And sometimes the fix is pretty simple—such as updating the text of the message an analyzer outputs! For example, we once rolled out an Error Prone check that flagged when too many arguments were being passed to a printf-like function in Guava that accepted only %s (and no other printf specifiers). The Error Prone team received weekly "Not useful" bug reports claiming the analysis was incorrect because the number of format specifiers matched the number of arguments—all due to users trying to pass specifiers other than %s. After the team changed the diagnostic text to state directly that the function accepts only the %s placeholder, the influx of bug reports stopped. Improving the message produced by an analysis provides an explanation of what is wrong, why, and how to fix it exactly at the point where that is most relevant and can make the difference for developers learning something when they read the message.
Suggested Fixes
Tricorder checks also, when possible, provide fixes, as shown in Figure 20-2.
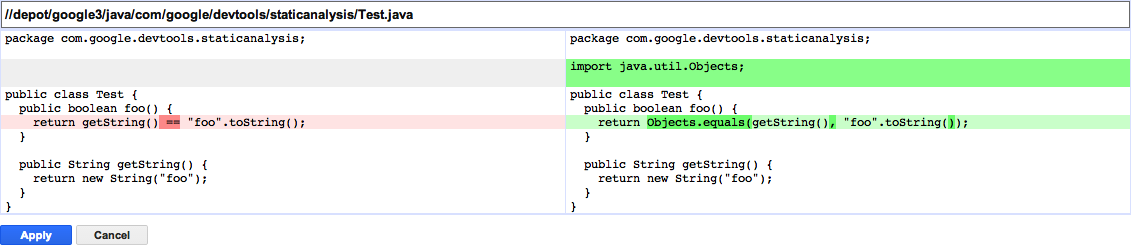
Automated fixes serve as an additional documentation source when the message is unclear and, as mentioned earlier, reduce the cost to addressing static analysis issues. Fixes can be applied directly from within Critique, or over an entire code change via a command-line tool. Although not all analyzers provide fixes, many do. We take the approach that style issues in particular should be fixed automatically; for example, by formatters that automatically reformat source code files. Google has style guides for each language that specify formatting issues; pointing out formatting errors is not a good use of a human reviewer’s time. Reviewers click “Please Fix” thousands of times per day, and authors apply the automated fixes approximately 3,000 times per day. And Tricorder analyzers received “Not useful” clicks 250 times per day.
Per-Project Customization
After we had built up a foundation of user trust by showing only high-confidence analysis results, we added the ability to run additional “optional” analyzers to specific projects in addition to the on-by-default ones. The Proto Best Practices analyzer is an example of an optional analyzer. This analyzer highlights potentially breaking data format changes to protocol buffers—Google’s language-independent data serialization format. These changes are only breaking when serialized data is stored somewhere (e.g., in server logs); protocol buffers for projects that do not have stored serialized data do not need to enable the check. We have also added the ability to customize existing analyzers, although typically this customization is limited, and many checks are applied by default uniformly across the codebase.
Some analyzers have even started as optional, improved based on user feedback, built up a large userbase, and then graduated into on-by-default status as soon as we could capitalize on the user trust we had built up. For example, we have an analyzer that suggests Java code readability improvements that typically do not actually change code behavior. Tricorder users initially worried about this analysis being too “noisy,” but eventually wanted more analysis results available.
The key insight to making this customization successful was to focus on project-level customization, not user-level customization. Project-level customization ensures that all team members have a consistent view of analysis results for their project and prevents situations in which one developer is trying to fix an issue while another developer introduces it.
Early on in the development of Tricorder, a set of relatively straightforward style checkers (“linters”) displayed results in Critique, and Critique provided user settings to choose the confidence level of results to display and suppress results from specific analyses. We removed all of this user customizability from Critique and immediately started getting complaints from users about annoying analysis results. Instead of reenabling customizability, we asked users why they were annoyed and found all kinds of bugs and false positives with the linters. For example, the C++ linter also ran on Objective-C files but produced incorrect, useless results. We fixed the linting infrastructure so that this would no longer happen. The HTML linter had an extremely high false-positive rate with very little useful signal and was typically suppressed from view by developers writing HTML. Because the linter was so rarely helpful, we just disabled this linter. In short, user customization resulted in hidden bugs and suppressing feedback.
Presubmits
In addition to code review, there are also other workflow integration points for static analysis at Google. Because developers can choose to ignore static analysis warnings displayed in code review, Google additionally has the ability to add an analysis that blocks committing a pending code change, which we call a presubmit check. Presubmit checks include very simple customizable built-in checks on the contents or metadata of a change, such as ensuring that the commit message does not say “DO NOT SUBMIT” or that test files are always included with corresponding code files. Teams can also specify a suite of tests that must pass or verify that there are no Tricorder issues for a particular category. Presubmits also check that code is well formatted. Presubmit checks are typically run when a developer mails out a change for review and again during the commit process, but they can be triggered on an ad hoc basis in between those points. See Continuous Integration for more details on presubmits at Google.
Some teams have written their own custom presubmits. These are additional checks on top of the base presubmit set that add the ability to enforce higher best-practice standards than the company as a whole and add project-specific analysis. This enables new projects to have stricter best-practice guidelines than projects with large amounts of legacy code (for example). Team-specific presubmits can make the large-scale change (LSC) process (see Large-Scale Changes) more difficult, so some are skipped for changes with “CLEANUP=” in the change description.
Compiler Integration
Although blocking commits with static analysis is great, it is even better to notify developers of problems even earlier in the workflow. When possible, we try to push static analysis into the compiler. Breaking the build is a warning that is not possible to ignore, but is infeasible in many cases. However, some analyses are highly mechanical and have no effective false positives. An example is Error Prone “ERROR” checks. These checks are all enabled in Google’s Java compiler, preventing instances of the error from ever being introduced again into our codebase. Compiler checks need to be fast so that they don’t slow down the build. In addition, we enforce these three criteria (similar criteria exist for the C++ compiler):
-
Actionable and easy to fix (whenever possible, the error should include a suggested fix that can be applied mechanically)
-
Produce no effective false positives (the analysis should never stop the build for correct code)
-
Report issues affecting only correctness rather than style or best practices
To enable a new check, we first need to clean up all instances of that problem in the codebase so that we don’t break the build for existing projects just because the compiler has evolved. This also implies that the value in deploying a new compiler-based check must be high enough to warrant fixing all existing instances of it. Google has infrastructure in place for running various compilers (such as clang and javac) over the entire codebase in parallel via a cluster—as a MapReduce operation. When compilers are run in this MapReduce fashion, the static analysis checks run must produce fixes in order to automate the cleanup. After a pending code change is prepared and tested that applies the fixes across the entire codebase, we commit that change and remove all existing instances of the problem. We then turn the check on in the compiler so that no new instances of the problem can be committed without breaking the build. Build breakages are caught after commit by our Continuous Integration (CI) system, or before commit by presubmit checks (see the earlier discussion).
We also aim to never issue compiler warnings. We have found repeatedly that developers ignore compiler warnings. We either enable a compiler check as an error (and break the build) or don’t show it in compiler output. Because the same compiler flags are used throughout the codebase, this decision is made globally. Checks that can’t be made to break the build are either suppressed or shown in code review (e.g., through Tricorder). Although not every language at Google has this policy, the most frequently used ones do. Both of the Java and C++ compilers have been configured to avoid displaying compiler warnings. The Go compiler takes this to extreme; some things that other languages would consider warnings (such as unused variables or package imports) are errors in Go.
Analysis While Editing and Browsing Code
Another potential integration point for static analysis is in an integrated development environment (IDE). However, IDE analyses require quick analysis times (typically less than 1 second and ideally less than 100 ms), and so some tools are not suitable to integrate here. In addition, there is the problem of making sure the same analysis runs identically in multiple IDEs. We also note that IDEs can rise and fall in popularity (we don’t mandate a single IDE); hence IDE integration tends to be messier than plugging into the review process. Code review also has specific benefits for displaying analysis results. Analyses can take into account the entire context of the change; some analyses can be inaccurate on partial code (such as a dead code analysis when a function is implemented before adding callsites). Showing analysis results in code review also means that code authors have to convince reviewers as well if they want to ignore analysis results. That said, IDE integration for suitable analyses is another great place to display static analysis results.
Although we mostly focus on showing newly introduced static analysis warnings, or warnings on edited code, for some analyses, developers actually do want the ability to view analysis results over the entire codebase during code browsing. An example of this are some security analyses. Specific security teams at Google want to see a holistic view of all instances of a problem. Developers also like viewing analysis results over the codebase when planning a cleanup. In other words, there are times when showing results when code browsing is the right choice.
Conclusion
Static analysis can be a great tool to improve a codebase, find bugs early, and allow more expensive processes (such as human review and testing) to focus on issues that are not mechanically verifiable. By improving the scalability and usability of our static analysis infrastructure, we have made static analysis an effective component of software development at Google.
TL;DRs
-
Focus on developer happiness. We have invested considerable effort in building feedback channels between analysis users and analysis writers in our tools, and aggressively tune analyses to reduce the number of false positives.
-
Make static analysis part of the core developer workflow. The main integration point for static analysis at Google is through code review, where analysis tools provide fixes and involve reviewers. However, we also integrate analyses at additional points (via compiler checks, gating code commits, in IDEs, and when browsing code).
-
Empower users to contribute. We can scale the work we do building and maintaining analysis tools and platforms by leveraging the expertise of domain experts. Developers are continuously adding new analyses and checks that make their lives easier and our codebase better.
1See http://errorprone.info/bugpatterns.
2Caitlin Sadowski et al. Tricorder: Building a Program Analysis Ecosystem, International Conference on Software Engineering (ICSE), May 2015.
3A good academic reference for static analysis theory is: Flemming Nielson et al. Principles of Program Analysis (Germany: Springer, 2004).
4Note that there are some specific analyses for which reviewers might be willing to tolerate a much higher false-positive rate: one example is security analyses that identify critical problems.
5See later in this chapter for more information on additional integration points when editing and browsing code.
6Louis Wasserman, “Scalable, Example-Based Refactorings with Refaster.” Workshop on Refactoring Tools, 2013.
7Caitlin Sadowski, Jeffrey van Gogh, Ciera Jaspan, Emma Söderberg, and Collin Winter, Tricorder: Building a Program Analysis Ecosystem, International Conference on Software Engineering (ICSE), May 2015.
8Caitlin Sadowski, Edward Aftandilian, Alex Eagle, Liam Miller-Cushon, and Ciera Jaspan, “Lessons from Building Static Analysis Tools at Google”, Communications of the ACM, 61 No. 4 (April 2018): 58–66, https://cacm.acm.org/magazines/2018/4/226371-lessons-from-building-static-analysis-tools-at-google/fulltext.